
Introduction
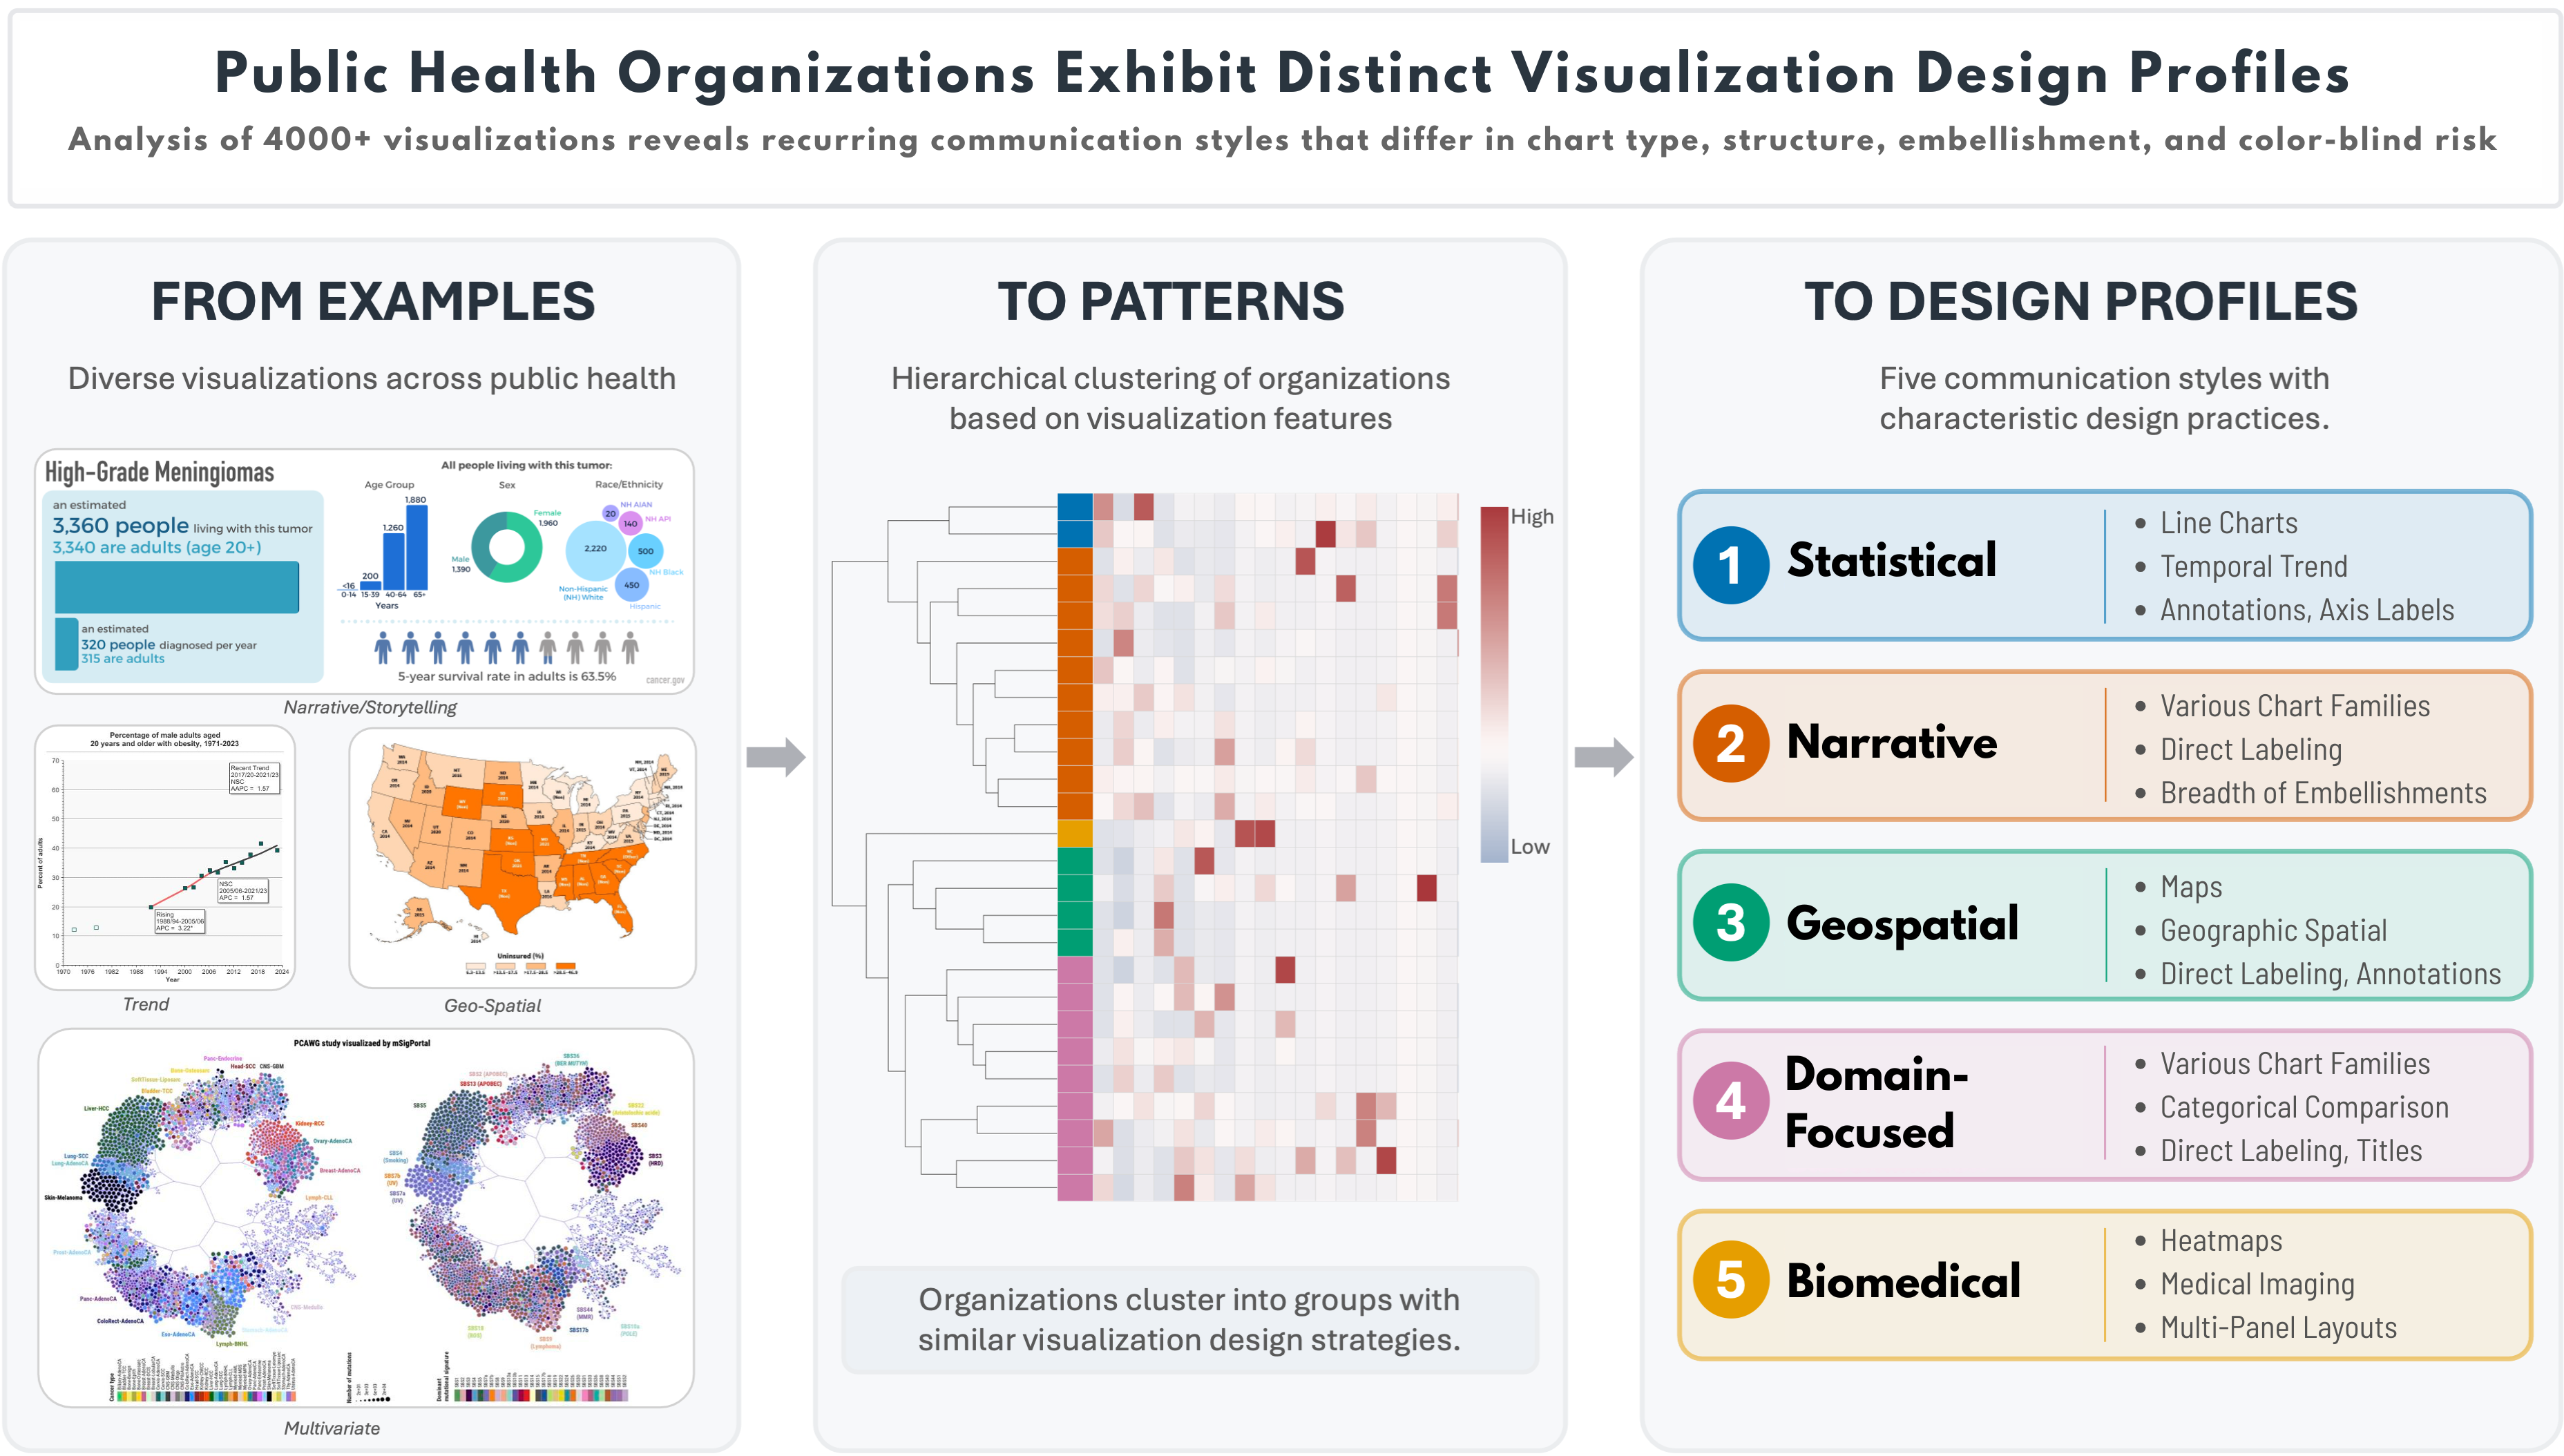
Abstract: Public health organizations regularly produce and publish data visualizations to raise awareness of critical issues, influence decision-making processes, and promote overall well-being. However, the design practices shaping these visualizations in real- world settings remain largely unexamined, limiting the research community’s ability to evaluate their effectiveness, accessibility, and alignment with communication goals. To address this gap, we construct and analyze a large-scale corpus of over 4,000 real-world data visualizations drawn from more than two dozen websites associated with U.S. and international public health organizations. We evaluate salient design characteristics like chart type, visualization accessibility, use of embellishments like iconography, and design flaws. This work contributes to understanding real-world decisions in designing data visualizations and supports public health officials in improving data visualization-related communications.
Published Materials
(available on the Github Repo)
- Visualizations from 26 Public Health Organizations
- Over 4,000 Visualizations
- Labeled Datasets (in JSON or CSV formats), including Codebook
- LLM Prompts & PCA Scripts
Visualization Copyright Consideration
DISCLAIMER! Visualizations collected from 26 public health organizations, the majority of which are U.S. government agencies whose visualizations are in the public domain. Data collection was limited to publicly available web pages. We have released the complete set of public-domain visualizations, along with the derived annotations, metadata, codebook, and analysis scripts, creating a resource for future research. Visualizations from nonprofit and international organizations cannot be redistributed because they may remain the intellectual property of their respective organizations; for these cases, we provide annotations and metadata to facilitate retrieval from the original sources where permitted. Researchers using the corpus for downstream applications, including computational model development, should ensure that their use complies with applicable copyright, licensing, and website terms.
Acknowledgements
This work is supported in part by the National Science Foundation under Grants Nos. 2142977 and 2330245, which support the Engineering Research Center for Carbon Utilization Redesign through Biomanufacturing-Empowered Decarbonization (CURB). M. Hines was supported by the following fellowship programs in sequential order: Clare Boothe Luce and NRT-AI: AI Advancements and Convergence in Computational, Environmental, and Social Sciences (AI-ACCESS) (No. 2244165).